New feature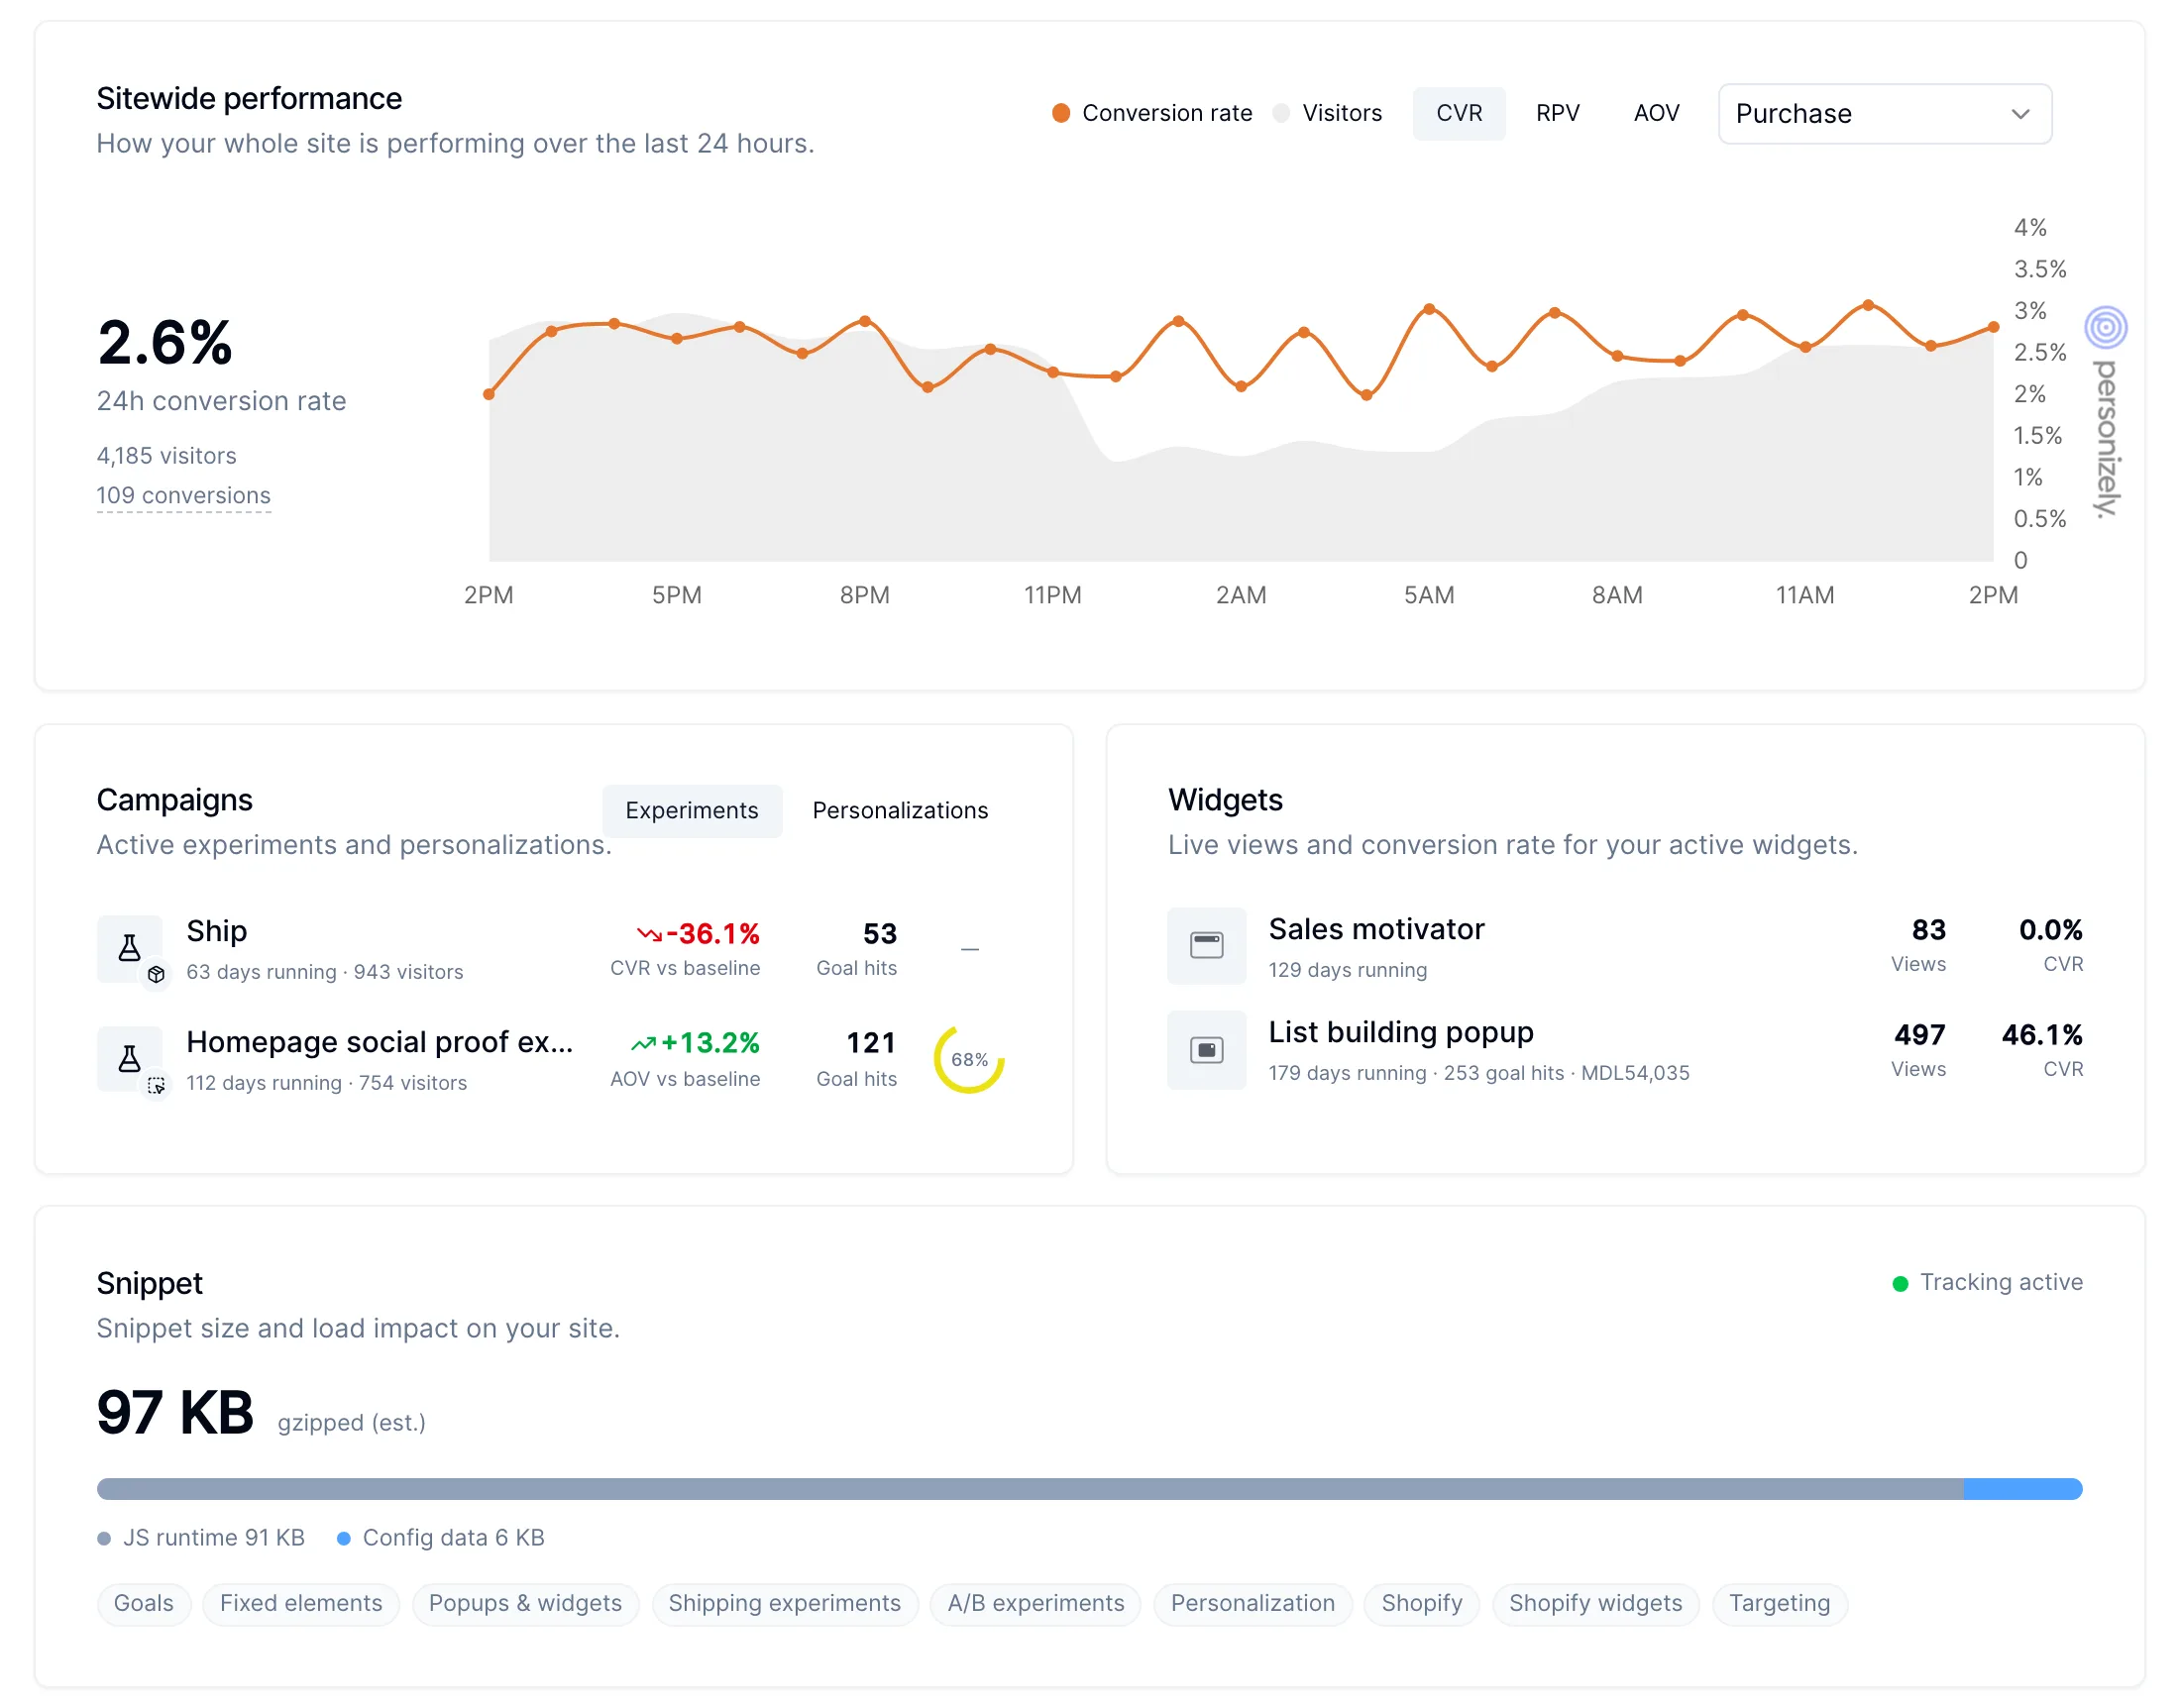
A new dashboard with your campaigns and widgets in one place
The dashboard has been rebuilt to answer "how is my site doing right now?" as soon as you log in. It covers the last 24 hours and shows your experiments and personalizations next to your widgets.
What is on it
- Sitewide performance: conversion rate, revenue per visitor (RPV) or average order value (AOV) for the whole site over the last 24 hours, hour by hour, for the goal you pick, with visitors in the background.
- Campaigns: your running experiments and personalizations, in two tabs. Each shows how long it has been running, its visitors, the change against the baseline on its primary metric, goal hits and how close an experiment is to its required sample size.
- Widgets: your active widgets with their live views and conversion rate.
- Snippet: the size of your Personizely snippet, split into the script and your configuration, which features it includes, and whether tracking is active.
Numbers are calculated from live data, and hours follow your timezone.