Personizelypersonizely.net

Personizely changelog

New features, improvements and fixes in Personizely, the Shopify experimentation platform.

October 2026

New feature

What we shipped since June

It has been a busy few months. Here are the highlights:

Plus many smaller improvements and fixes.
Improvement

Redirect the control group too in URL split tests

A new setting for redirect campaigns sends visitors in the control group through the same redirect as the variations. Use it when you want every group to have the same page-load behavior, so redirect timing does not skew results.

  • Experiments

September 2026

Improvement

Smaller improvements and fixes in August and September

  • Campaign list: filter by deployed campaigns, and long names no longer break the layout.
  • Product campaigns cannot be started until their price selectors are configured, and the editor links to the docs for CSS selectors.
  • Fixes: first visit and first session targeting on Shopify, tracking for shipping experiments, form submits in product clone campaigns, and templates that load with a delay.
New feature

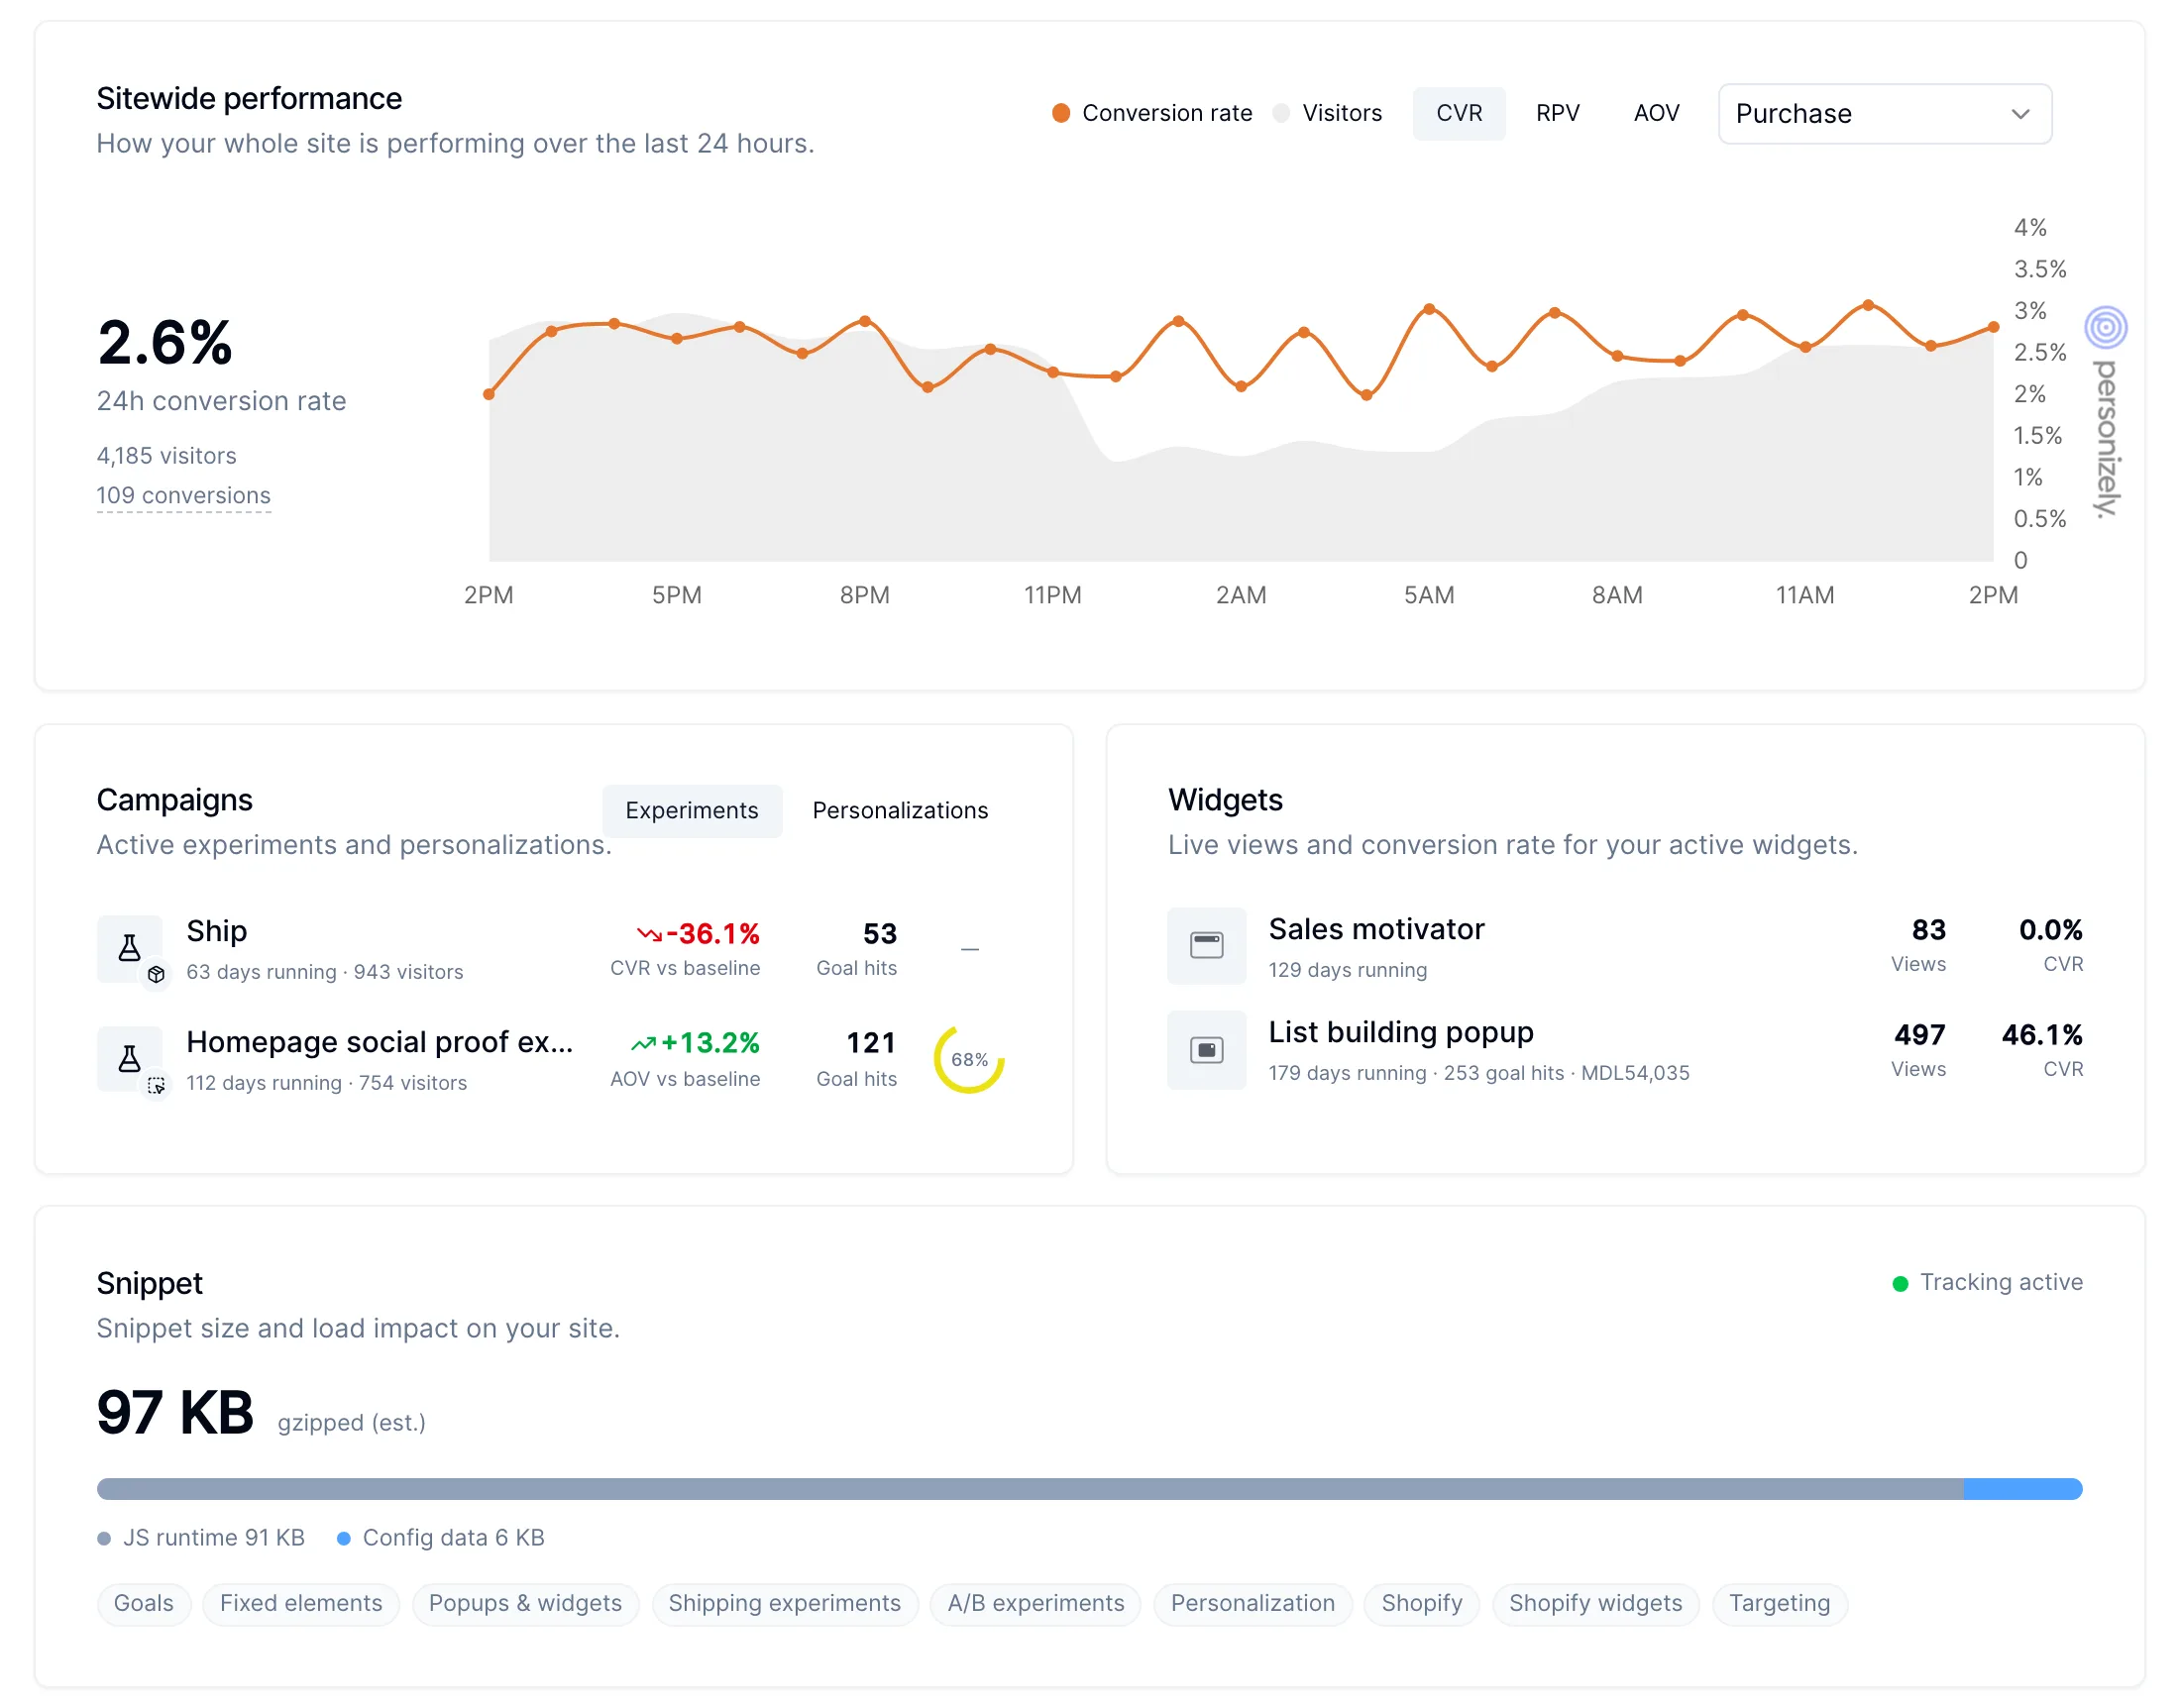
A new dashboard with your campaigns and widgets in one place

A new dashboard with your campaigns and widgets in one place

The dashboard has been rebuilt to answer "how is my site doing right now?" as soon as you log in. It covers the last 24 hours and shows your experiments and personalizations next to your widgets.

What is on it

  • Sitewide performance: conversion rate, revenue per visitor (RPV) or average order value (AOV) for the whole site over the last 24 hours, hour by hour, for the goal you pick, with visitors in the background.
  • Campaigns: your running experiments and personalizations, in two tabs. Each shows how long it has been running, its visitors, the change against the baseline on its primary metric, goal hits and how close an experiment is to its required sample size.
  • Widgets: your active widgets with their live views and conversion rate.
  • Snippet: the size of your Personizely snippet, split into the script and your configuration, which features it includes, and whether tracking is active.

Numbers are calculated from live data, and hours follow your timezone.

  • Analytics
New feature

Clone elements in the campaign editor

You can now duplicate any element on your page in the campaign editor and change the copy, instead of building it from scratch.

  • Editor
Improvement

Personizely now works on your phone

Personizely now works on your phone

The Personizely app was barely usable on a phone. It is now fully responsive, so you can check results and manage your account from anywhere:

  • Analytics and reports: dashboards, campaign and widget reports, experiment results and filters.
  • Lists and settings: campaigns, widgets, targets and all account and website settings.

The widget builder and the visual campaign editor still need a bigger screen, so they stay desktop only.

  • App
Improvement

URL split tests across subdomains

URL split campaigns now work when the original page and the variations live on different subdomains of the same site, for example www.example.com and shop.example.com. Before, a visitor redirected to another subdomain could be counted as a new visitor and placed in a different group. Now they keep their assigned variation and are counted once.

This does not cover completely different domains, for example example.com and example-shop.com. Browsers keep their data separate, so visitors may still be assigned again on the other domain.

  • Experiments
New feature

See how your personalization control group performs

Personalization reports now let you drill down into the control group, just like the personalized variations, so you can see exactly what the personalization is adding.

In the same release, goals can be filtered by order tags in reports and through the API.

  • Personalization
  • Analytics

August 2026

New feature

@personizely/sdk: full-stack experiments in Node, the browser and the edge

Our new JavaScript SDK lets developers run full-stack experiments, feature flags and personalizations anywhere JavaScript runs: in the browser, on a Node server or at the edge. Decisions are made locally from your website's campaign data, so there is no network call per decision, and each visitor always lands in the same variation.

npm install @personizely/sdk
import { Personizely } from '@personizely/sdk'

const ply = new Personizely({ apiKey: 'your-website-key' })
await ply.ready()

const result = await ply.runCampaign(1234)
if (result?.getFeature('checkout-v2').enabled) {
  // show the new checkout
}

It reports impressions, events and goals to Personizely like the regular snippet, so results show up in your campaign reports. The SDK runs full-stack campaigns only; content, product, shipping, URL split and template campaigns keep running through the Personizely snippet on your store.

See the package page on npm for setup and examples.

  • API

July 2026

Improvement

Smaller improvements and fixes in June and July

  • More reliable Shopify tracking. Events now go through Personizely's own host first and fall back to Shopify's proxy, which was slow and caused missed events. Bot detection also runs inside the Shopify web pixel, and we removed a check that wrongly flagged visitors using in-app browsers like Facebook's.
  • More accurate significance for revenue per visitor, with improved statistical calculations for revenue-based experiments.
  • Purchase events include location and device data, so orders can be broken down by country and device.
  • Goals: add many products to a purchase goal at once, and page goals can now match query strings.
  • Wix: support for the Wix product catalog V3.
  • Shipping experiments: a clearer setup wizard and several fixes for derived rates and URLs with parameters.
  • Billing: view your subscription details, add a coupon, and add a payment method when a plan change fails.
  • Campaign builder: the cart now works while editing campaigns with the Chrome extension.
  • Faster reports after a round of database and query optimizations.
Improvement

Split experiment traffic evenly in one click

Split experiment traffic evenly in one click

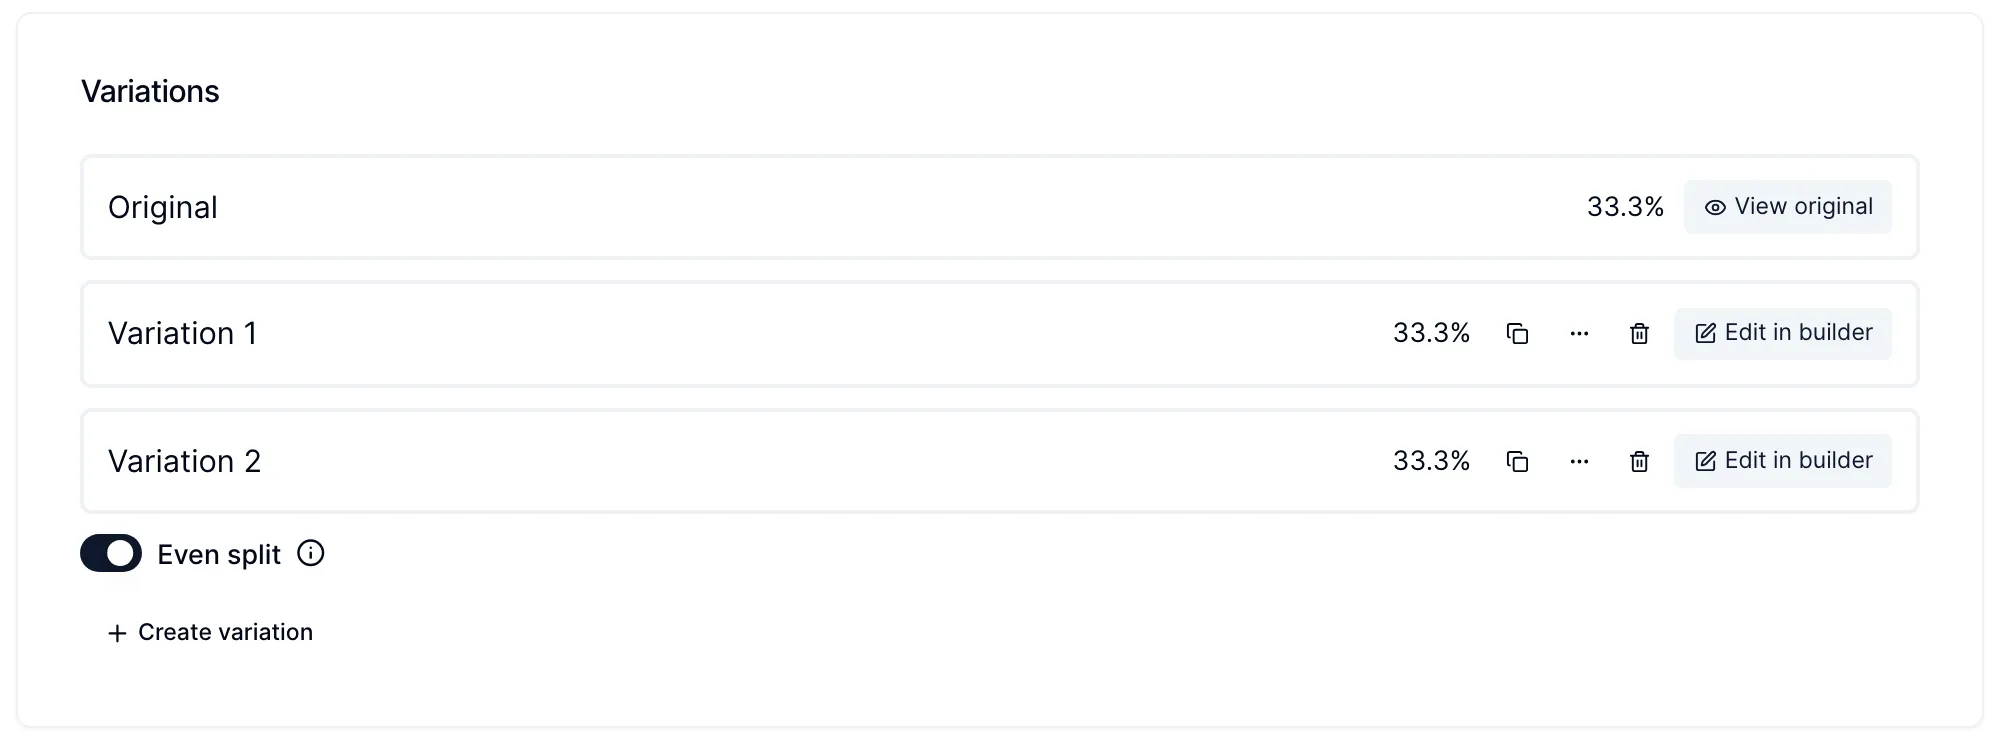
Experiments have a new Even split switch that divides traffic equally between the control group and every variation. Whole percentages cannot split traffic evenly three, six or seven ways (33% + 33% + 34% is not even), so with the switch on each group gets exactly the same share.

You will find it next to the variations in campaign experiments, in widget experiments and when you create a new experiment. While it is on, the individual percentages are locked and show the equal share (for example 33.3%). Add or remove a variation and the split adjusts automatically. Turn it off to set the shares by hand again.

The switch can be changed until the campaign is deployed.

  • Experiments
Improvement

Goal conversion rate now counts visitors, not hits

Goal conversion rate is now calculated the same way everywhere: visitors who reached a goal at least once, divided by the visitors the widget or campaign reached.

Before, widget reports divided the total number of goal hits by the number of views. A visitor who saw a popup three times and clicked twice counted as three views and two goal hits, which made rates swing with how often a widget was shown and how many times people clicked. Campaigns already used visitors, so the two kinds of reports did not compare.

What changed

  • One definition. Widgets, widget experiments and campaigns all use visitors with goal hits divided by reach (unique visitors).
  • More reliable winners. Confidence in widget experiments is now calculated on unique visitors, so one enthusiastic visitor can't tip a test.
  • Both numbers are still there. Reports show Visitors with goal hits and Total goal hits side by side. Hover over a goal count to see both.
  • Consistent names. Widget experiment metrics now use the same names as campaigns, Conversion rate, Goal conversion rate and Revenue per visitor, in the app, in exports and in the API.

What you might notice

Goal conversion rates for widgets will look different from before, usually lower if visitors trigger goals repeatedly, or higher if your widgets are shown many times per visitor. The new numbers are the ones to compare across widgets and campaigns. Your data has not changed, only how it is summarized.

  • Analytics
  • Widgets
  • Experiments
Improvement

Filter out bots and abusive traffic automatically

Filter out bots and abusive traffic automatically

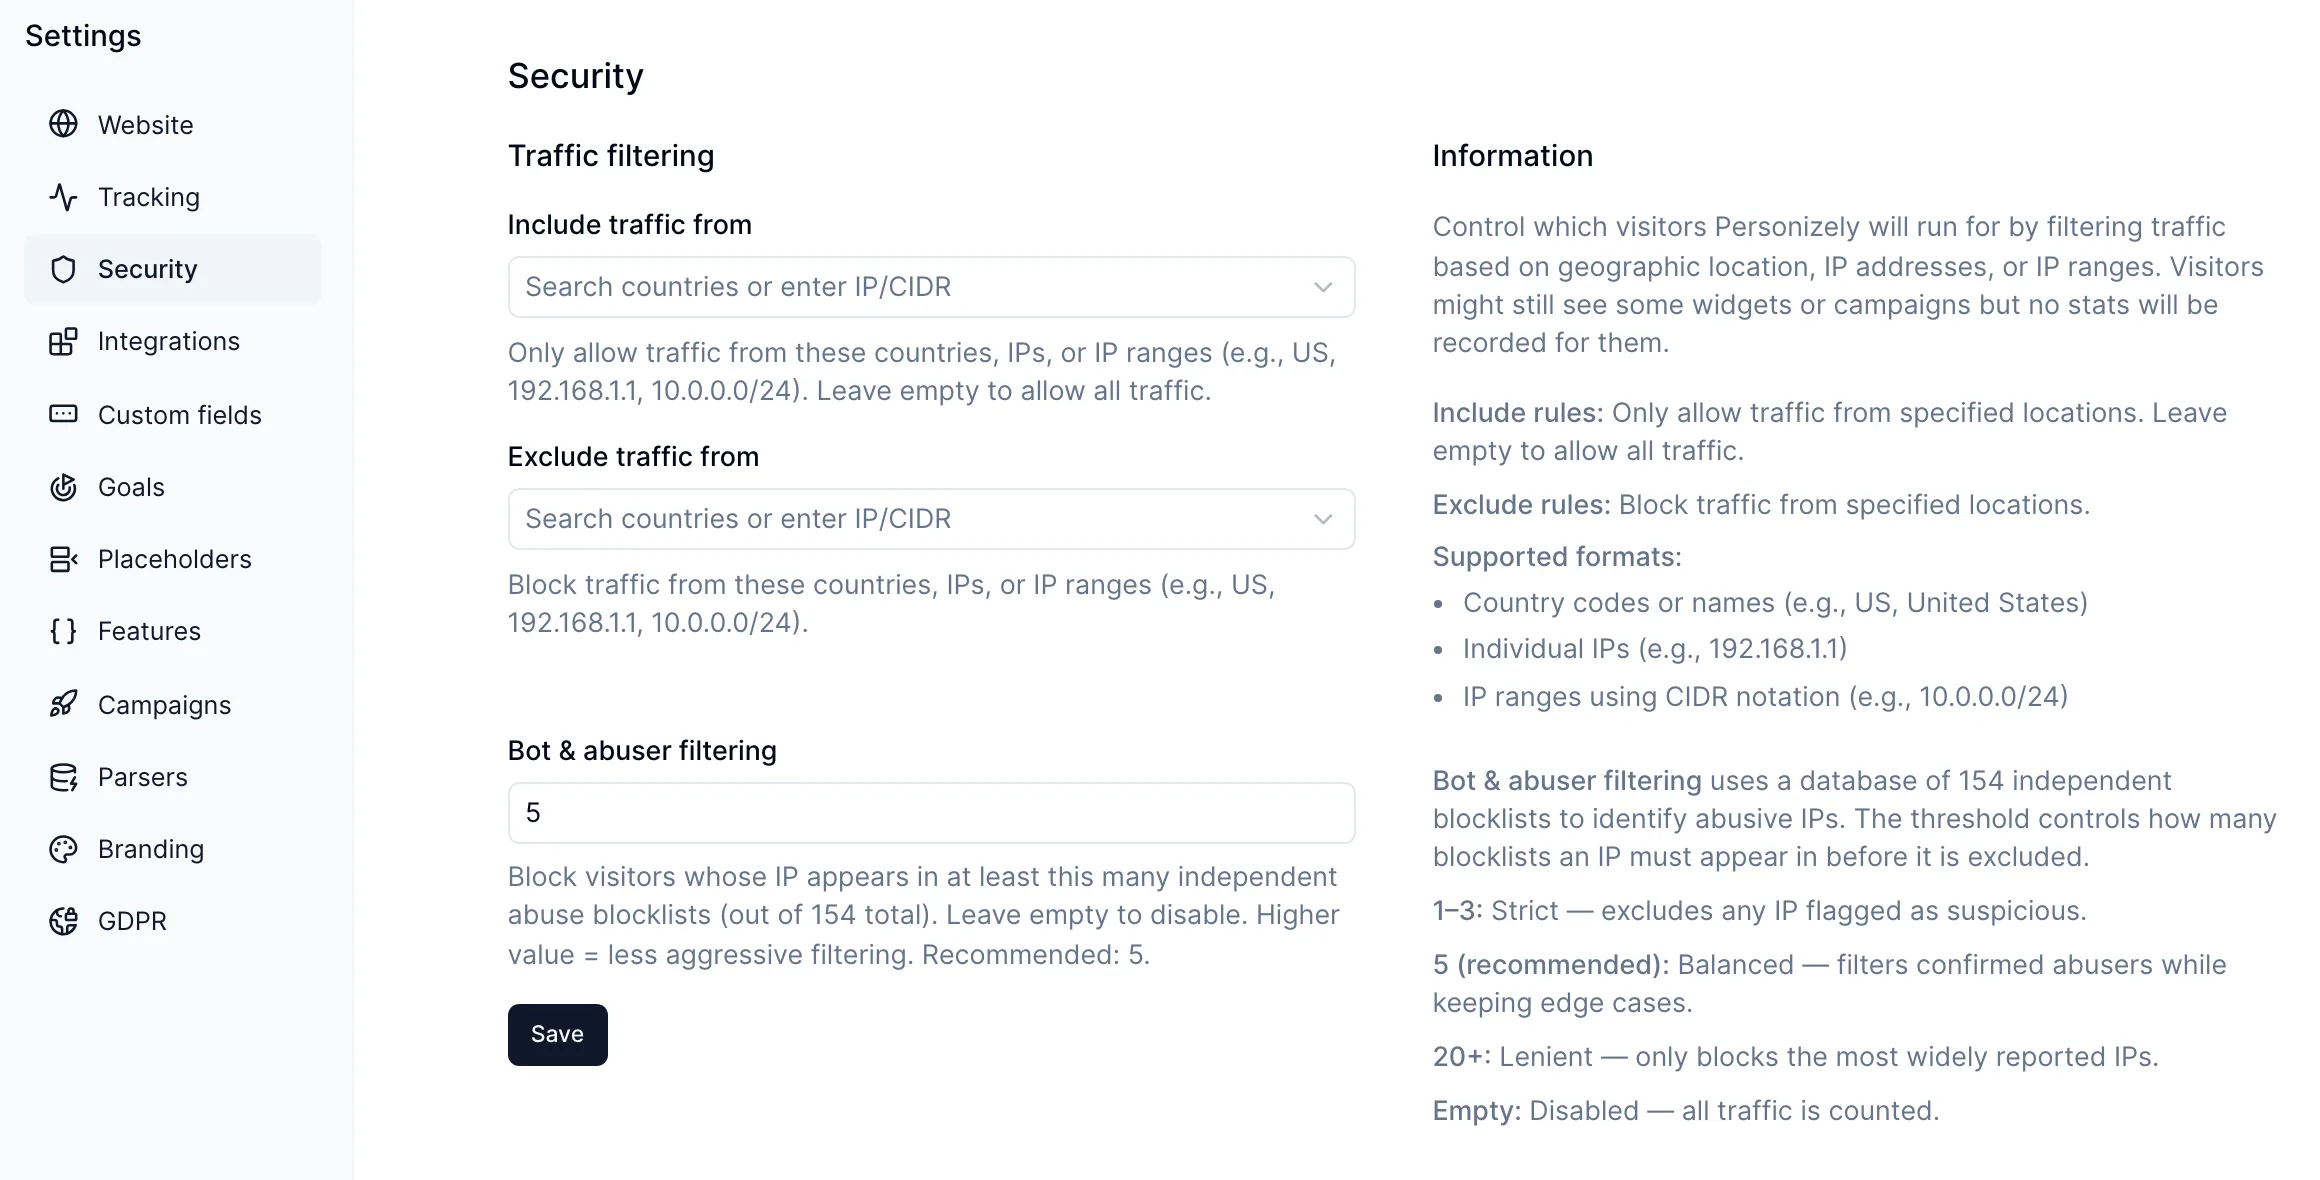
You can now filter out visitors whose IP address is known for abuse, such as scrapers, click bots and spam networks, so they no longer count toward your visitors, conversion rates or experiment results.

How to turn it on

Go to Settings > Security and set Bot & abuser filtering to a number. A visitor is filtered out when their IP appears on at least that many independent abuse blocklists, out of 154 that we check.

  • 1 to 3 is strict: any IP flagged as suspicious is excluded.
  • 5 is the recommended starting point. It filters confirmed abusers while keeping edge cases.
  • 20 or more is lenient and only filters the most widely reported addresses.
  • Empty turns filtering off, which is the default.

Filtered visitors are not recorded in your stats. They might still see some widgets or campaigns.

This works alongside the country and IP rules in the same settings page, which let you allow or block specific traffic yourself.

Filtering applies from the moment you save; past data is not changed.

  • Analytics
  • App
New feature

Count orders when they are created, not only when they are paid

Count orders when they are created, not only when they are paid

Until now, a Shopify order counted as a conversion for your campaigns and widgets only once it was paid. That works for most stores, but orders paid later, such as cash on delivery, bank transfers or payment on invoice, were attributed late or not at all, so experiments in markets that rely on them looked worse than they were.

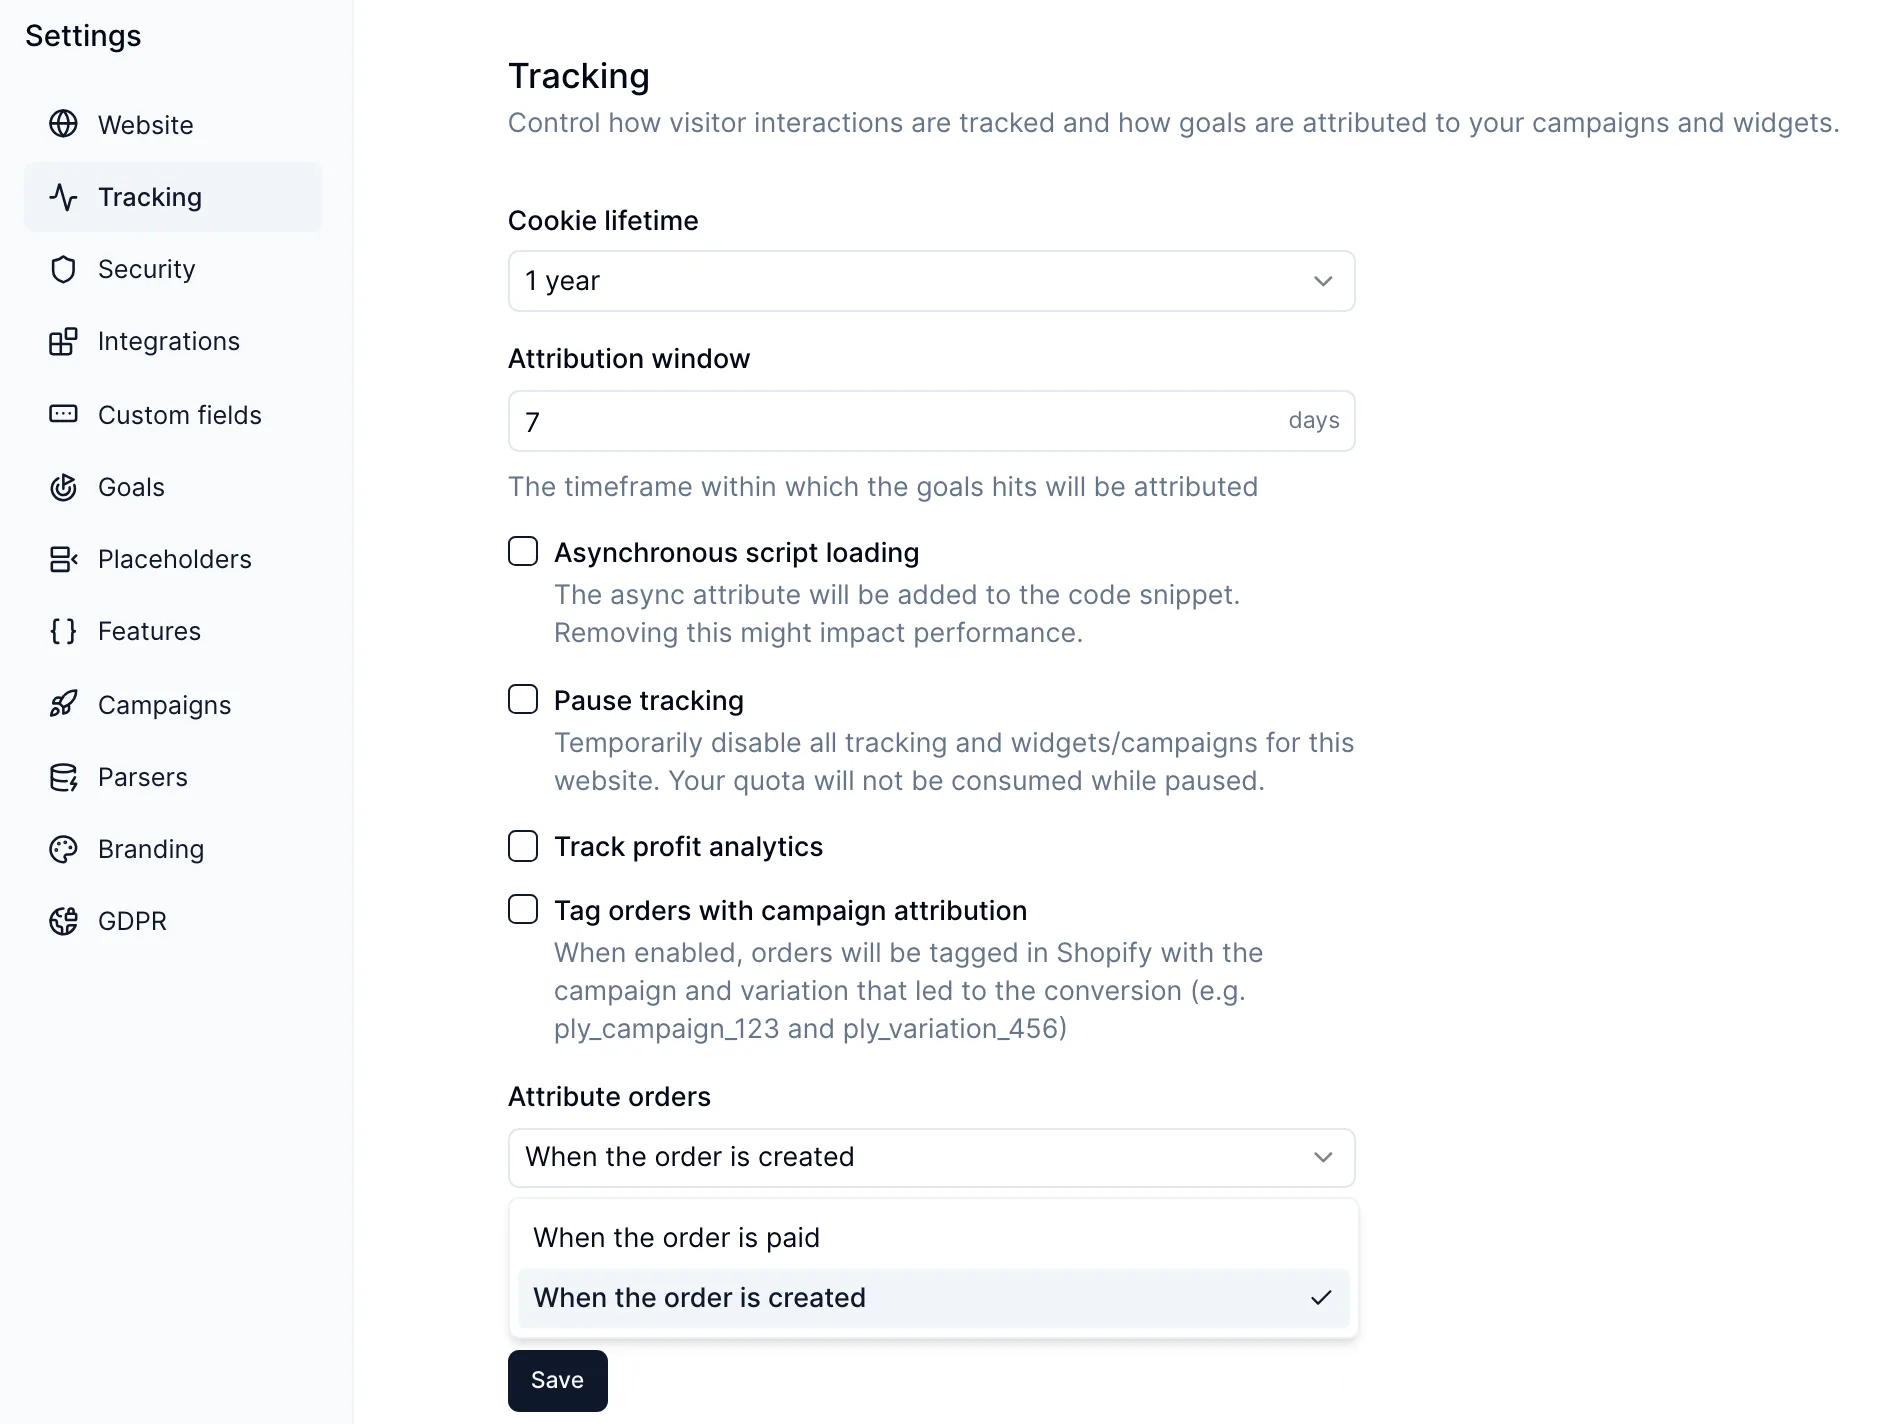
You can now choose when an order is attributed:

  • When the order is paid (default). Only paid orders count, so revenue in your reports matches money received.
  • When the order is created. Every order counts the moment it is placed, including cash on delivery and other unpaid orders.

How to set it

Go to Settings > Tracking and pick an option under Attribute orders. It applies to your whole Shopify store and takes effect for orders from the moment you save; past orders are not recounted.

Use When the order is created if a meaningful share of your orders is paid later. Keep the default if most of your customers pay at checkout.

  • Experiments
  • Analytics
  • Shopify

June 2026

New feature

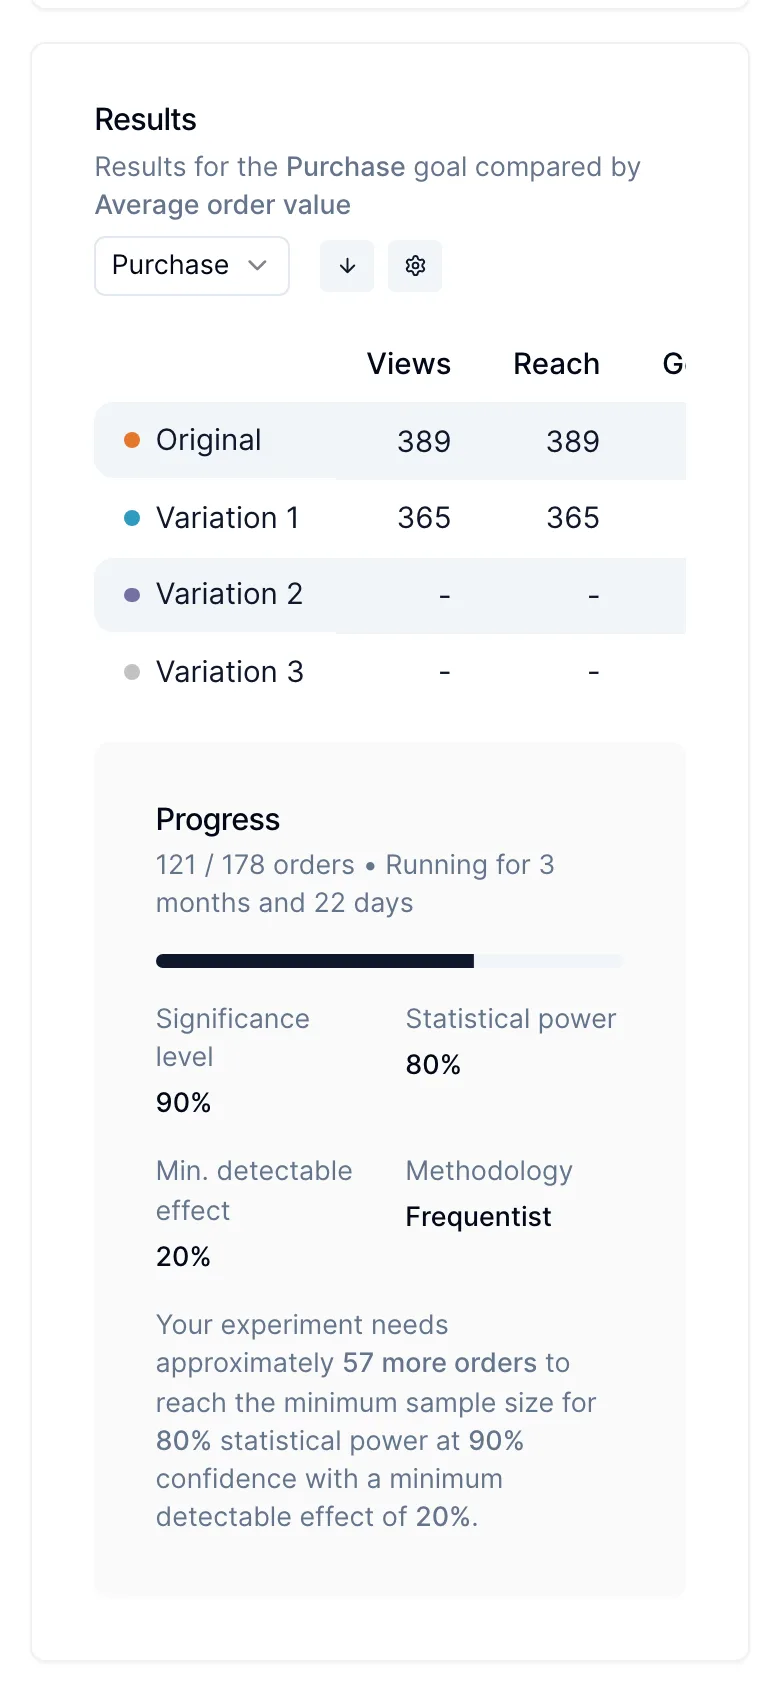
Choose the primary metric for each campaign, including AOV

Choose the primary metric for each campaign, including AOV

You can now pick the metric each campaign is judged on, and average order value (AOV) is one of the options. Reports and the winner verdict follow the metric you choose, so a test meant to raise basket size is not declared a loser just because its conversion rate did not move.

How to set it

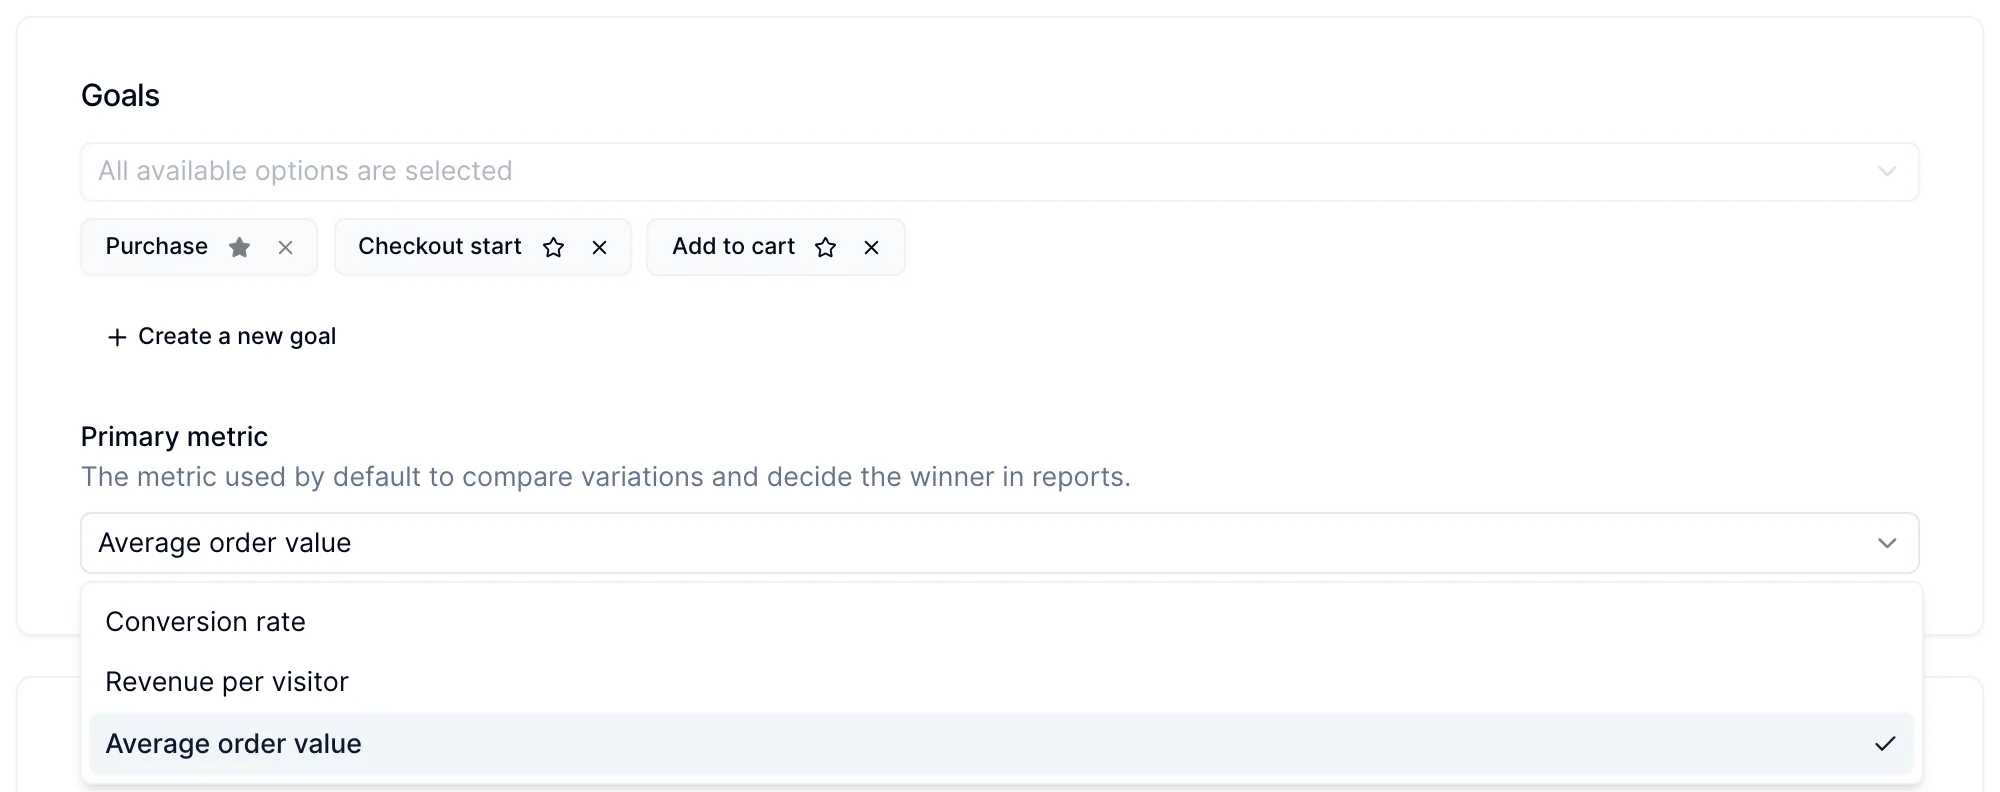
Open a campaign and find Primary metric in the Goals section. The options are:

  • Conversion rate (default): the share of visitors who reached the primary goal.
  • Revenue per visitor: revenue divided by all visitors in each group. A good all-round choice for revenue tests.
  • Profit per visitor: only shown when profit analytics is on for your website.
  • Average order value: revenue per order. Use it for upsells, bundles and free-shipping thresholds, where the goal is bigger orders rather than more of them.

The primary metric sets the default view and decides the winner. You can still switch the Compare by selector in the report to look at the other metrics. The same setting is available through the API and the MCP server.

In August we also started showing the estimation formula even when the control is the winner, so you can always see how an estimate was reached.

  • Experiments
  • Analytics
New feature

Spin-to-win wheel for widgets

Spin-to-win wheel for widgets

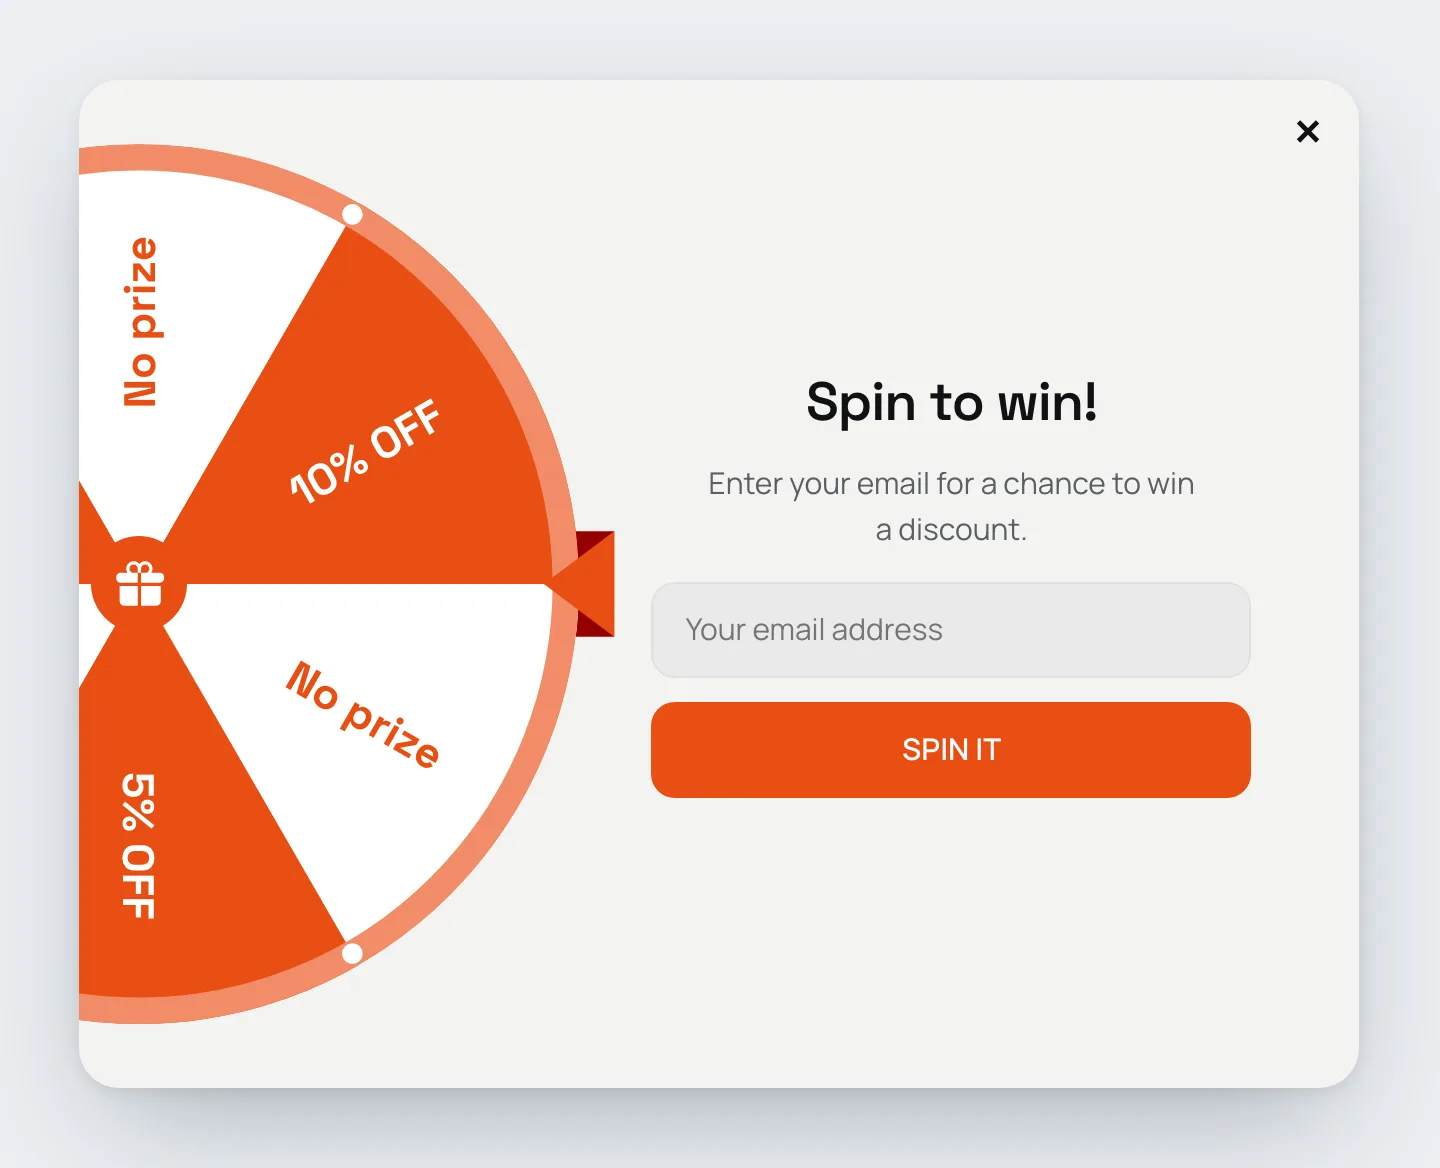
Add a wheel of fortune to any widget. Visitors spin it for a chance to win a discount, which makes list-building and discount popups more engaging than a plain form.

Start from a template

Spin-to-win templates are available under List building, with an email field visitors fill in before they spin, and under Promo, without one. Each comes in two layouts: the wheel above the text, or a half wheel on the side with the form next to it. They pick up your theme's colors and fonts. Each comes with six segments (10% off, 5% off, free shipping, "Try again" and two "No prize"), a reward step with a coupon code for every prize and a "Better luck next time" step. Replace the sample codes with your own before you publish.

You can also add the Wheel of Fortune element to any existing widget, and use the Spin the wheel action on a button or form to start the spin.

Set up each segment

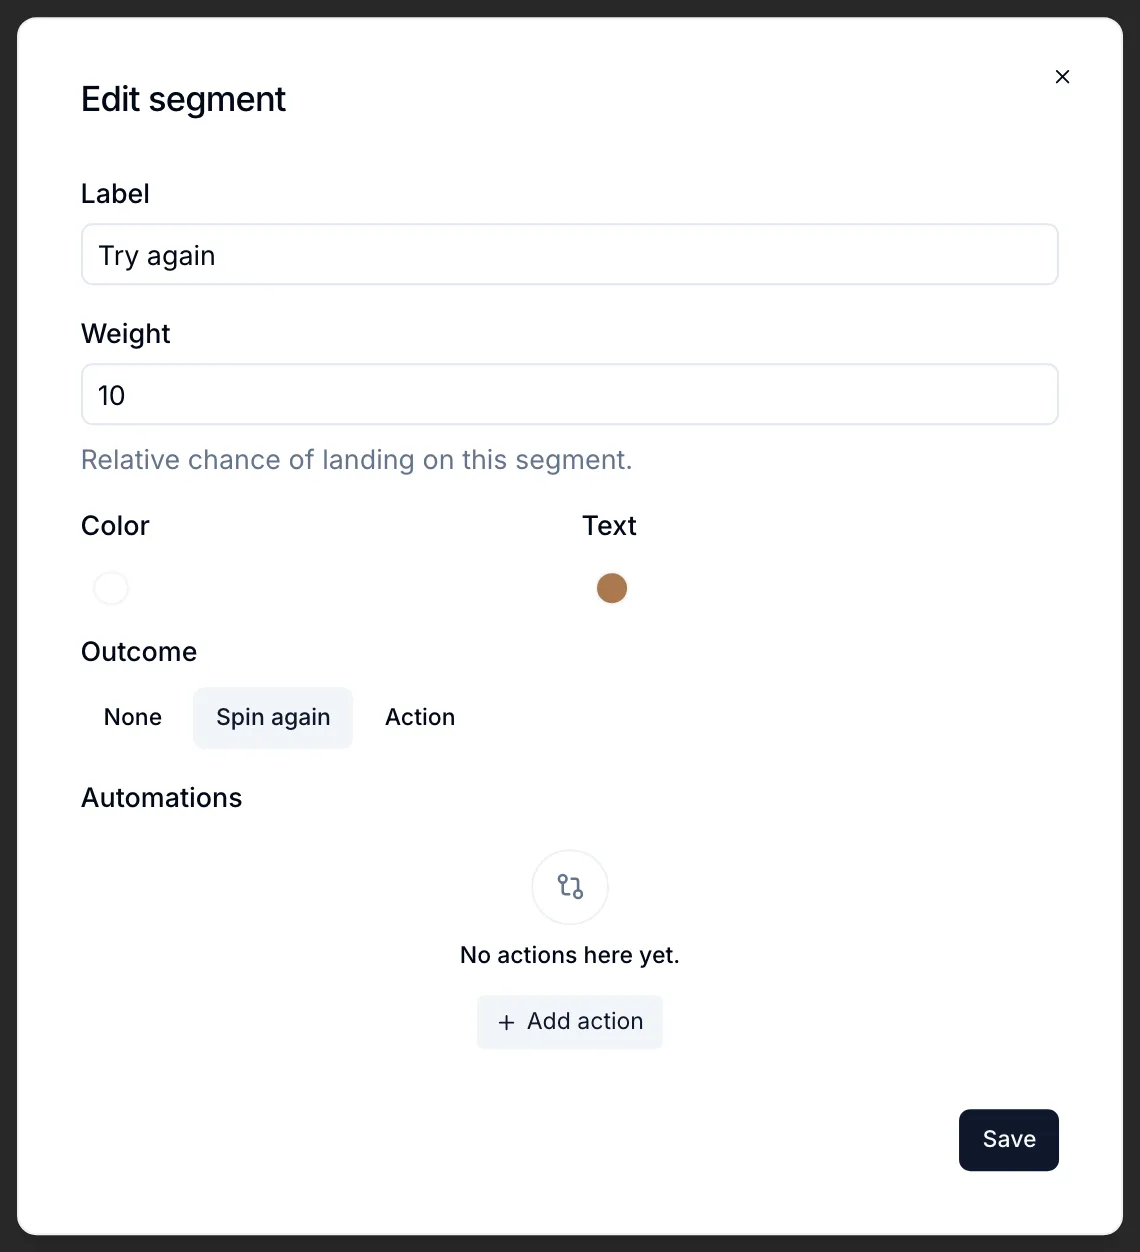
Click a segment in the element settings to edit:

  • Label, Color and Text color.
  • Weight: the relative chance of landing on it. A segment with weight 2 is hit twice as often as one with weight 1.
  • Outcome, what happens when the wheel stops on it:
    • None: nothing, the wheel just shows the result.
    • Spin again: the visitor gets another spin.
    • Action: for example go to the step with the matching coupon, open a URL or close the widget. Integration automations can run per segment too.

Edit segment window with label, weight, colors and outcome

The wheel itself has a Spin duration and a Result delay (a short pause before the outcome runs), and you can style the labels, rim, dots, pointer (top or right) and the hub in the middle (an icon, text or nothing).

Spins are tracked as their own event, separately from views and clicks.

  • Widgets
Improvement

Test prices for products that have subscriptions or bundles

You can now a/b test product prices for products that have bundles and subscriptions. This is possible by creating duplicate products and a URL split mechanism to make sure that for each product, a visitor sees the subscriptions or the bundles assigned to it.

Note that you have to configure a subscription or bundle for each of the products individually, in case you want them to be specific to that variation.

Also, make sure to swap the variation products in case you are planning to delete the campaign, so that the customers can keep their subscription running.

May 2026

New feature

The Personizely MCP Server and API

The Personizely MCP Server and API

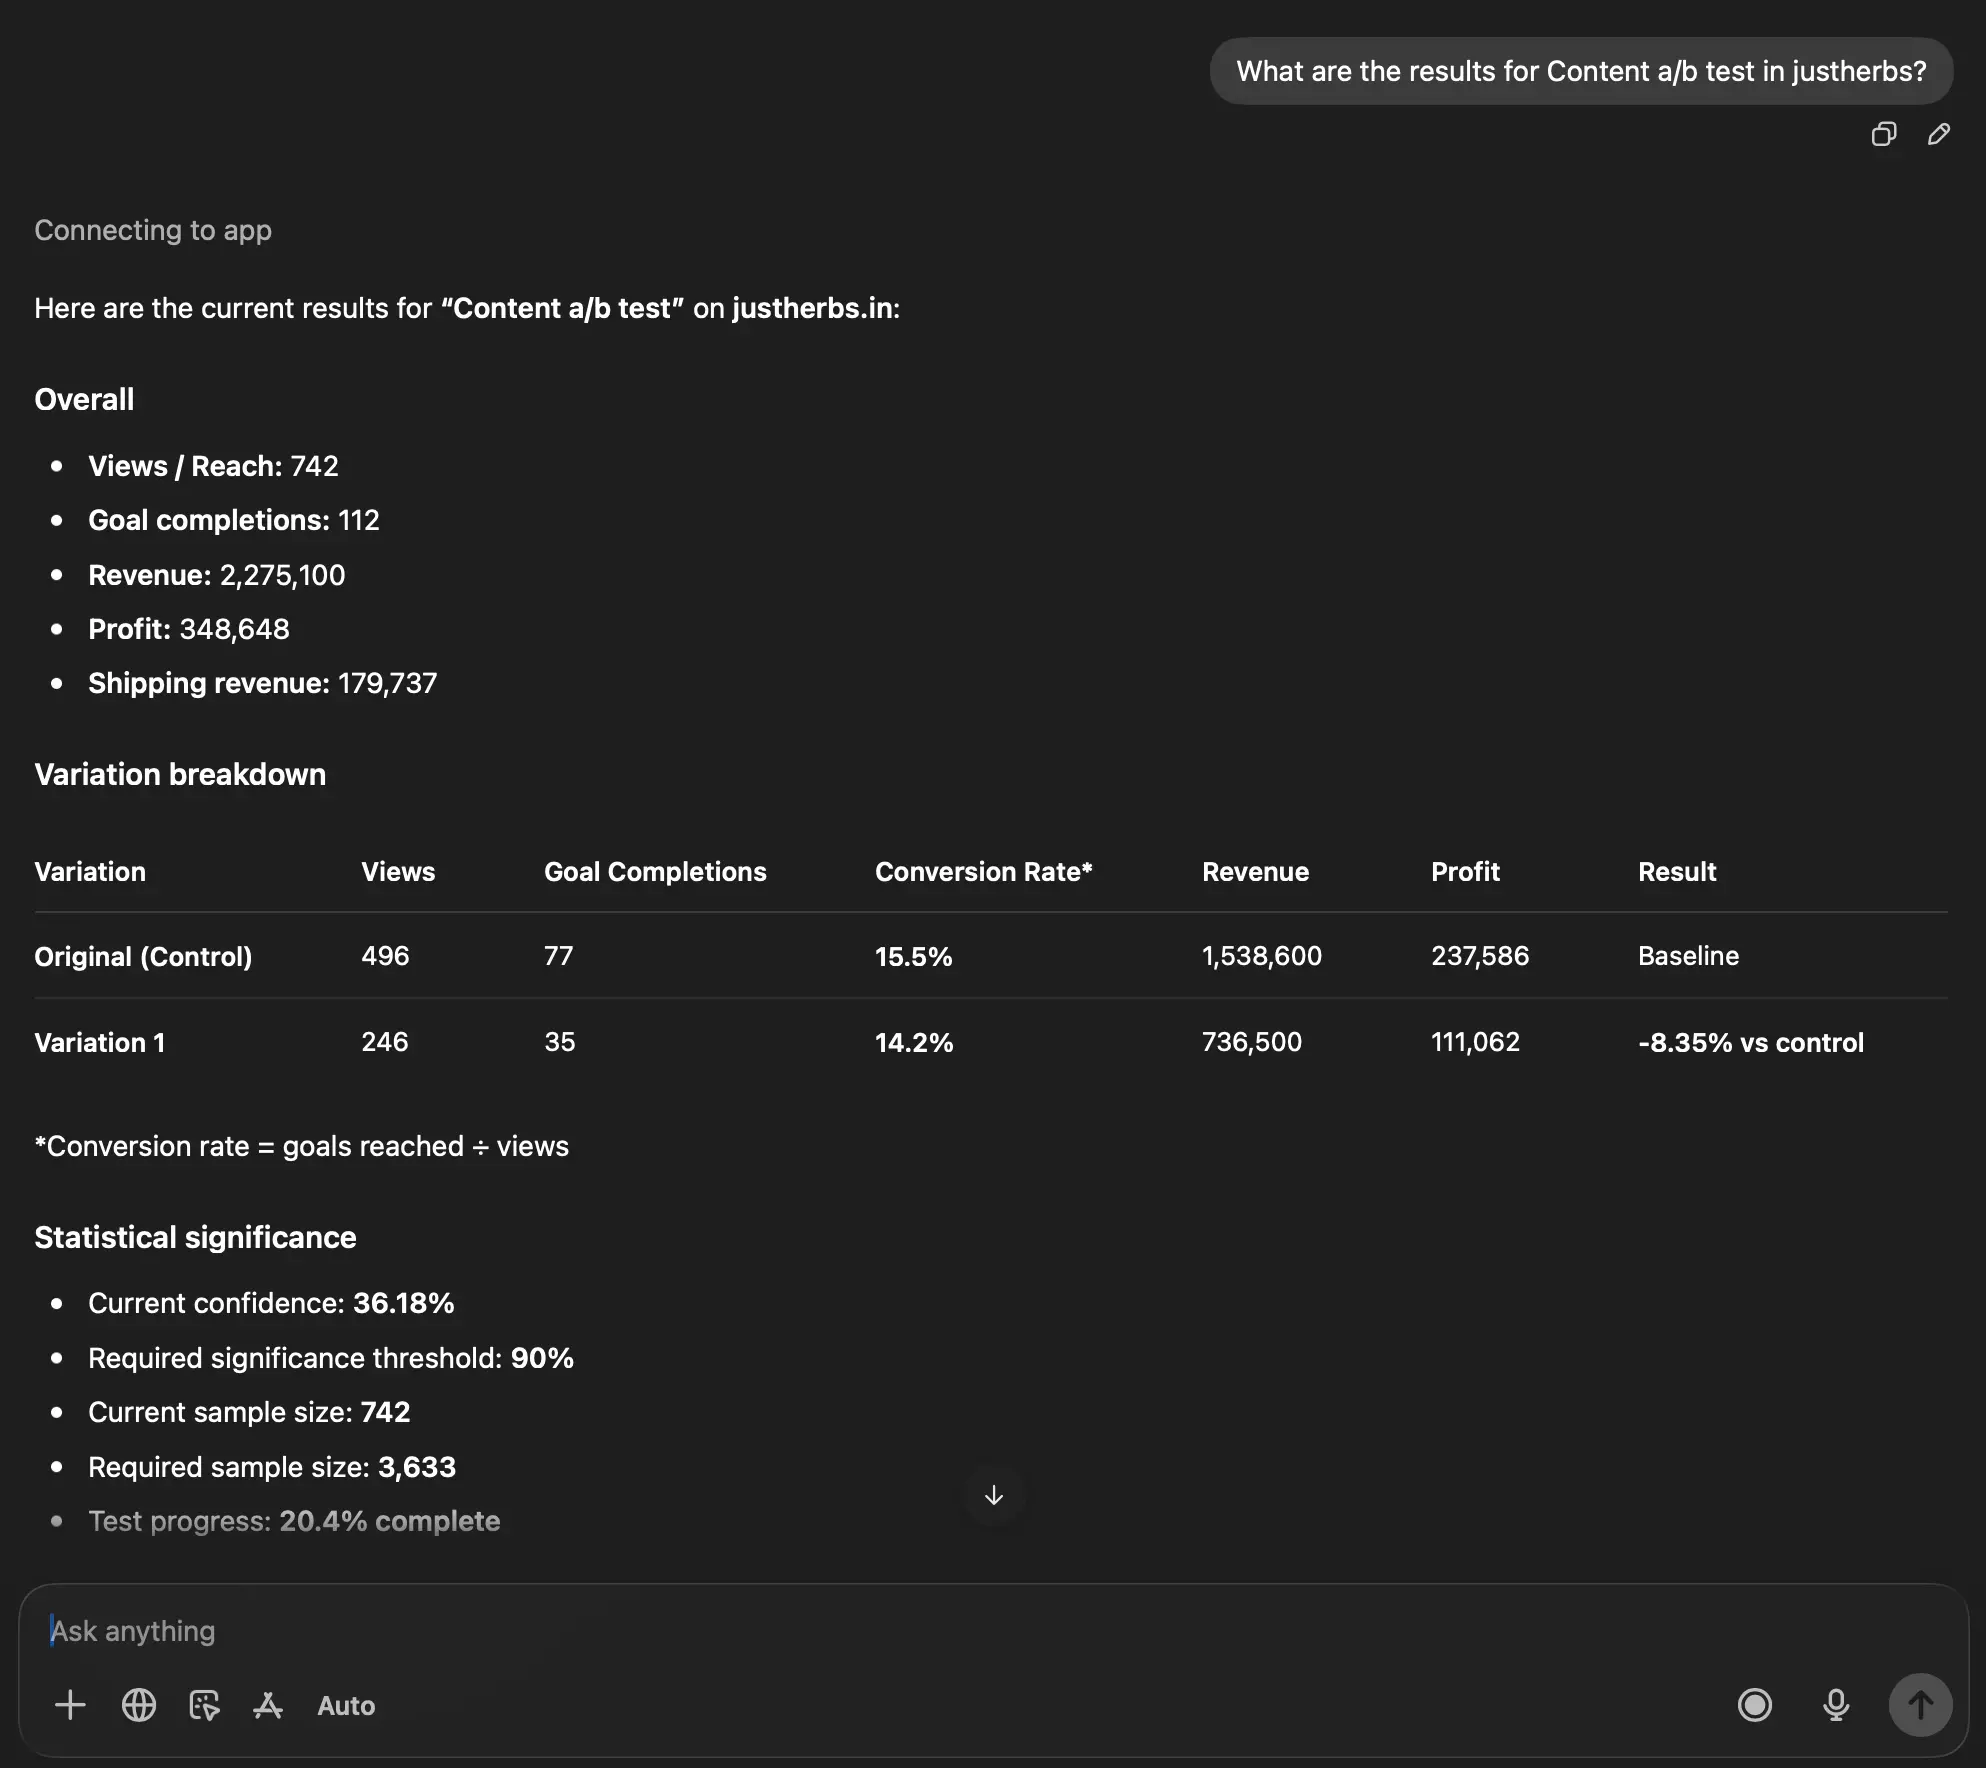
Personizely now offers an MCP server at https://mcp.personizely.net that you can easily connect to in the AI chats you use every day - like ChatGPT, Claude, Claude Code and others. This allows you to "talk" to your data and use AI to help you interpret campaign results.

To find out more, read our documentation: https://docs.personizely.net/mcp-server

The MCP communicates via our newly released Public API, which you can use to build various tools or AI skills via API Keys. You can find the API reference here: https://docs.personizely.net/list-campaigns

April 2026

Improvement

Minor improvements

During the past weeks we've shipped several quality of life improvements.

Widget report export - You can now export the general widgets stats like views, conversions, goal hits, etc. using a button at the top of the widget report.

Order history targeting - You can now target visitors based on past orders that have specific tags.

Theme experiment alerts - We'll now show the missing templates when running a theme experiment - so if the variant theme doesn't have some templates that are present in the original theme - you'll get a warning so you can make sure that your site looks right on all variations.

New feature

Outlier detection

Outlier detection

You will now get a warning in the campaign report if your experiment has been attributed outlier orders based on the z-score of your past purchase events (orders). You can also review and remove these conversions from your campaign.